Program at a glance (Updated 3/11)
10th March (Mon)
7:30 ? 9:00: Breakfast
9:00 – 9:30: Opening
| Introduction to NII Shonan Meetings (Soichiro Hidaka) |
| Opening message (Arie E. Kaufman) |
9:30 – 10:30: Session 1 (Chair: Arie E. Kaufman)
 |
|
New Tasks for Visualization Research
Hans Hagen, Christoph Garth
TU Kaiserslautern, Germany
Abstract:
The past decades have witnessed a fruitful period of visualization research that has provided methods and techniques, as well as general principles, to approach a wide variety of visualization problems in science and engineering. However, changes may be needed in future research to accommodate changing scientific problems and workflows. First, modern science has extended beyond understanding single-field data, rather, multi-modal multifield data is becoming the norm rather than an exception. Furthermore, there are classes of data that do not fit well into mathematical models underlying current visualization paradigms. Secondly, data sizes obtained from computational experiment is very rapidly becoming a problematic factor in ensuring interactive, exploratory visualization. In order for scientific visualization research to remain a key ingredient in the scientific process, these problems will have to be solved. I will illustrate these points and discuss possible solutions.
Slides
|
|
|
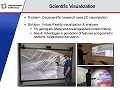
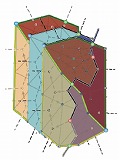
Tensor Visualization Guiding Component Design
Gerik Scheuermann
(joint work with A. Kratz, I. Hotz, V. Zobel, B. Burgeth, M. Schoeneich, M. Stommel)
University of Leipzig, Germany
Abstract:
Despite several interesting approaches, tensor visualization is nearly completely ignored by engineers. It has not found its way into commercial software for structural mechanics. In this talk, we will discuss potential reasons for this fact. Essentially, we claim that engineers need to be convinced that tensor visualizations can help them with their design task. We demonstrate this using a typical engineer design task, the design of rib structures in a brake lever for a bike. Here, we show that tensor visualization can lead to substantially better designs. We prove the superiority of the new designs according to standard engineering procedures. We expect that these and other developments will lead to the use of tensor visualizations in structural mechanics in the future.
Slides
|
10:30 ? 11:00: Break
11:00 – 12:00: Session 2 (Chair: Issei Fujishiro)
|
|
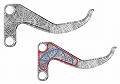
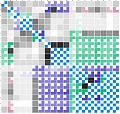
No More Hairballs: Using Matrices to Unravel Relationships in Complex Interactomes
Raghu Machiraju
The Ohio State University, USA
Abstract:
Graphs are traditionally used to describe interactions between entities (or the interactome) in networks arising in social media and biological contexts. However, graphical techniques soon create nightmarish hairballs which do not offer useful insights into the underlying phenomenon-under-scrutiny. To address this challenge, we have been exploring techniques that summarize a scatterplot matrix, or SPLOM, as a clustered matrix of glyphs, or Glyph SPLOM. These glyphs visually encode a general measure of dependency strength and category as manifest in each scatterplot between pairs of entities (or variables).
We present Glyph SPLOM as a general alternative to traditional correlation heatmaps and SPLOMs using a variety of examples from the biological sciences. By using both dependency class and strength, the Glyph SPLOM illustrates high dimensional data in more detail than a heatmap but with more summarization than a SPLOM. More importantly, the summarization capabilities of Glyph SPLOM allow for the assertion of “necessity” causal relationships in the data and the reconstruction of interaction networks in various dynamical systems. In essence, one can still use graphs and not hairballs to glean the underlying interactome.
Slides
|
 |
|
Particle-Based Rendering and its Applications
Koji Koyamada
Kyoto University, Japan
Abstract:
It is crucial to render multiple objects in a single scene in order to model a complex phenomena by using simulation technologies. To construct numerical simulation models capable of predicting future states with high precision, observation data should be measured at appropriate positions if we use a data assimilation technology. To locate measurement devices at appropriate positions, the simulation results should be visualized so that the measurement results can be well compared with them. These results are usually defined at different grids, where measurement results use coarser grids that simulation results. In this context, the multiple objects include volumes, semi-transparent surfaces, lines and points which are generated from a simulation or measurement result.
Previously, it is regarded as a difficult process to interactively render multiple objects since a costly visibility sorting is required at each viewing point. Apparently, there is a case in which such a sorting is not possible. In multiple volume datasets, the volume cells can be overlapped. That is why a sorting-free rendering algorithm is strongly required.
In this talk, we describe a technique for stochastic rendering, which can integrally handle multiple objects including volumes and surfaces without visibility sorting. To develop a sorting-free rendering algorithm, we revisit a brightness equation in the volume rendering algorithm and reconsider the definition of opacity which is usually derived from a user-specified transfer function.
This leads to two approaches, object space approach and image space approach. In the former one, we define a density function of emissive opaque particles. According to the density function, we generate particles in a given volume dataset and project them onto an image plane. Since we use an opaque particle, no visibility sorting is required. In the latter approach, we regard the brightness equation as the expected value of the luminosity of a sampling point along a viewing ray, and we propose a sorting-free approach that simply controls the fragment rendering by using the evaluated opacity value to calculate a rendered image.
Using these approaches, a technique to handle multiple objects, especially multiple volumes, can be easily developed. In our experiments, we applied our technique to several numerical simulation results and confirmed its effectiveness by showing the performance results and demonstrating the application of our technique to computation results of massive dispersed objects in a blood vessel with a diameter of approximately 100 μm. To figure out the relation between platelets and red blood cells, we developed a level-of-detail rendering which integrated the object space approach and image space approach.
Slides
|
12:00 ? 13:30: Lunch
13:30 ? 14:00: Group Photo Shooting
14:00 – 15:30: Session 3 (Chair: Hans Hagen)
|
|
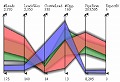
The ND-Scope: Visual Exploration of High-Dimensional Data
Klaus Mueller
Stony Brook University, USA
Abstract:
The growth of digital data is tremendous. Any aspect of life and matter is being
recorded and stored on cheap disks, either in the cloud, in businesses, or in
research labs. We can now afford to explore very complex relationships with many
variables playing a part. But for this we need powerful tools that allow us to
navigate and create insight from the large raw block of data. High-quality
visual feedback plays a decisive role here. In this talk, I will first provide
some fundamental insight into the peculiarities of high-dimensional data spaces
and will then discuss our recent software framework, called “The ND-Scope”,
which incorporates various facilities for high-dimensional data exploration. The
ND-Scope was conceived in tight collaborations with a number of domain users
from climate and environmental science, computer systems, and business. I will
present use cases resulting from these studies.
Slides
|
 |
|
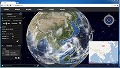
AVIS: A Web-based Visualization System of Large-scale 3D Atmosphere Data
Wei Chen
Zhejiang University, China
Abstract:
Visualizing the climate data has been a challenging task because the climate data is large-scaled, time-varying, heterogeneous, and multi-variate. In this talk, I will present our recent progress on visualizing large-scale climate data that combines simulated and observed data, namely, the remote sense images, the infrared images, the terrain maps, the WRF-model based atmosphere data, the sea flow data, as well as routine documentary data. The integrated system has been developed and used in Chinese Meteorological Administration. A prototype of a web-service based system will be introduced.
Slides PDF | PPT
|
|
|
Visualization through Textualization
Ye Zhao
Kent State University, USA
Abstract:
Significant progresses have been made in information visualization and visual analytics of large datasets. Despite the advances, there still exists a wide gap between what users want and what the visualizations can provide. Visual metaphors unfamiliar to novice users, cluttered views, and complicated interactions in existing visual analytics systems prevent general users from quickly discovering and managing insights. Therefore, interactive visual exploration of large, complex datasets can only be performed by a small number of visualization experts and domain experts collaborating with them.
In this project, we will develop visualization techniques to fully utilize the power of text. Text is an intelligent tool that helps people convey information and form opinions promptly. A variety of abstract data will be processed and analyzed in semantic-rich forms by externalizing and refining associated contextual information of the original data. Text mining techniques will then be enabled to discover patterns and trends of the data. The discoveries will then be expressed as visual and textual expressions. Users can explore the discoveries, generate and evaluate hypothesis, and report their findings by interactively exploring the textual data.
Slides
|
15:30 ? 16:00: Break
16:00 – 18:00: Session 4 (Chair: Kwan-Liu Ma)
 |
|
Are there Better Ways to Depict Molecules?
Hans-Christian Hege
Work in collaboration with Norbert Lindow and Daniel Baum
Zuse Institute Berlin (ZIB), Germany
Abstract:
Molecular phenomena depend on the shape of molecules as well as on molecular forces that act between the molecules and their parts. Many molecular phenomena can be “understood” by looking at molecular shapes and their changes due to molecular forces. This justifies the use of molecular graphics and also explains its success. There is a rich history of depicting molecules. On the one hand, researchers have tried to depict molecules as realistic as possible. On the other hand, they have aimed at drawing them as simple as possible ? initially to not overstrain computer graphics, and later to keep depictions of complex molecular systems comprehensible. As a result, increasingly abstract graphical representations have been invented that serve different needs and that are used today in molecular sciences.
Considering molecular processes on biological length scales the question arises, how to create multi-scale representations in which molecular shapes are simplified in a continuous and imperceptible way when increasing the length scale. This question is not pursued here. Instead, the opposite direction is addressed: Are the usual representations accurate enough to understand molecular phenomena in detail?
Important biophysical phenomena, like the transport of molecules through a biological membrane, often depend on fine details. It turns out that current types of molecular depictions sometimes do not allow us to draw the correct conclusions. When trying to more accurately depict molecular details, the key question is: What is the real shape of a molecule? And, depending on the answer to this question: How can more realistic depictions be created?
Molecules are spatially extended objects. Therefore it makes sense to talk about the shape of a molecule, although, in contrast to macroscopic objects, it cannot be determined with methods of geometrical optics. An operational procedure to determine the shape (which can be applied also to macroscopic bodies) is via repulsive forces that prevent interpenetration of bodies. This method is particularly appropriate when the mutual accessibility of molecules is of interest. In contrast to the macroscopic domain, however, one cannot use a fine tip for scanning the object. Instead, one uses objects of similar size, namely atoms or molecules that carry own force fields. The result therefore depends on the ‘probe’. Nevertheless, one gets exactly the information that is required when reachability of molecules is analyzed.
Two extensions of classical molecular depictions will be sketched that are based on this operational definition: (a) the data-driven determination of effective atomic radii and (b) the computation of surfaces that show how close a molecule can approach another molecule ? without approximating the first molecule crudely by a sphere.
Slides
|
 |
|
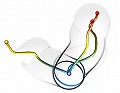
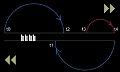
A Visualization Technique for Many Temporal Patterns
Kazuo Misue
University of Tsukuba, Japan
Abstract:
A temporal pattern is a set of time-stamps that accompany events. It is important to identify remarkable features of temporal patterns in event data. However, it is difficult to observe many temporal patterns because most naive methods require certain area to visualize a temporal pattern. I propose a technique to represent a temporal pattern by a position inside a circle. By using this technique, we can simultaneously visualize many events and easily compare their occurrence patterns. This technique may be said as a kind of dimensionality reduction. In my talk, I will introduce the technique and want to discuss its potential and limitations.
Slides | Movie 01, 02
|
 |
|
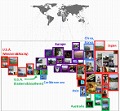
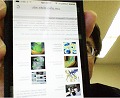
Visualization for Multimedia Contents
Takayuki Itoh
Ochanomizu University, Japan
Abstract:
We can store huge amount of multimedia contents including photographs and tunes thanks to recent evolution of portable multimedia devices and high-speed network infrastructure. It is not always easy to quickly find demanded contents from such large collections. Information visualization is effective for interactive browsing and retrieval of such multimedia contents. The presenter introduces his own works on browsers of photograph and music, and user experiences using the browsing software.
Slides
|
 |
|
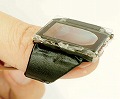
Natural and Tangible User-interactions
Robin Bing-Yu Chen
National Taiwan University, Taiwan
Abstract:
In this talk, I will focus on introducing the recent projects related to the natural and tangible user-interactions which can also be used to support interactive visualization, including PUB (ACM UIST 2011), NailDisplay (ACM CHI 2013 Best Paper Award), FingerPad (ACM UIST 2013), GaussSense (ACM UIST 2012), GaussBits (ACM CHI 2013), and GaussBricks (ACM CHI 2014). PUB (Point Upon Body) is a project to explore eyes-free interaction in a personal space by allowing users tapping on their own arms to be provided with haptic feedback from their skin. To achieve this, an UltraSonic device is developed to be attached on the users’ wrists to detect their tapped positions.
NailDisplay is a novel and always-available nail mounted display, which augments the use of a finger by allowing for always-available visual feedback owing to its fast accessibility and binding user controls with the display. Instead, FingerPad is a nail-mounted device that turns the tip of the index finger into a touchpad, allowing private and subtle interaction while on the move. This is achieved by using GaussSense, which is a back-of-device sensing technique for enabling input on an arbitrary surface by exploiting magnetism. Attaching the sensor behind an arbitrary thin surface enables the stylus input to be recognized by analyzing the distribution of the applied magnetic field. Besides, it can also support GaussBits as well as GaussBricks, which is a system of the passive magnetic tangible designs that enables 3D tangible interactions in the near-surface space of portable displays.
Slides
|
18:00 ? 19:30: Dinner
11th March (Tue)
7:30 ? 9:00: Breakfast
9:00 – 10:30: Session 5 (Chair: Xioayang Mao)
|
|
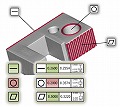
Visualization for Non-Destructive Testing
Eduard Gröller
Technical University Vienna, Austria
Abstract:
New materials like carbon fiber reinforced polymers (CFRP) require novel non-destructive testing approaches. 3D X-Ray Computed Tomography (XCT) is a scanning modality for the analysis and visualization of features and defects in industrial work pieces. Several application scenarios are discussed in this respect:
Porosity maps allow the characterization of porosity in carbon fiber reinforced polymers. Besides quantitative porosity determination and the calculation of local pore properties, i.e., volume, surface, dimensions and shape factors, we employ a drill-down approach to explore pores in a CFRP specimen.
MObjects are an aggregated approach for the visualization and interactive exploration of defects in industrial XCT. Mean objects (MObject) and mean object sets (MObject Sets) are visualized in a radial and parallel arrangement. Non-destructive testing practitioners use representative MObjects to improve ultrasonic calibration curves and as input for heat conduction simulations in active thermography.
Fuzzy CT Metrology can be used for dimensional measurement on uncertain data. Using 3D XCT the location of the specimen surface is estimated. Our technique provides the domain experts with uncertainty visualizations, which extend the XCT metrology workflow on different levels. The developed techniques are integrated into a tool utilizing linked views, smart 3D tolerance tagging and plotting functionalities.
Due to the rapid development of scanning devices, material sciences and non-destructive testing constitute a challenging application domain for innovative visualization research.
Slides | Movie 01 02 03
|
|
|
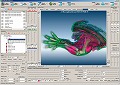
FluoRender: an Interactive Rendering Tool for Confocal Microscopy Data Visualization
Chuck Hansen
SCI Institute, University of Utah, USA
Abstract:
Confocal microscopy is widely used in neurobiology for studying the three-dimensional structure of the nervous system. Confocal image data are often multi-channel, with each channel resulting from a different fluorescent dye or fluorescent protein; one channel may have dense data, while another has sparse; and there are often structures at several spatial scales: subneuronal domains, neurons, and large groups of neurons (brain regions). Even qualitative analysis can therefore require visualization using techniques and parameters fine-tuned to a particular dataset. Despite the plethora of volume rendering techniques that have been available for many years, the techniques standardly used in neurobiological research are somewhat rudimentary, such as looking at image slices or maximal intensity projections. Thus there is a real demand from neurobiologists, and biologists in general, for a flexible visualization tool that allows interactive visualization of multi-channel confocal data, with rapid fine-tuning of parameters to reveal the three-dimensional relationships of structures of interest.
Together with neurobiologists, we have designed such a tool, FluoRender, choosing visualization methods to suit the characteristics of confocal data and a typical biologist’s workflow. We use interactive volume rendering with intuitive settings for multidimensional transfer functions, multiple render modes and multi-views for multi-channel volume data, and embedding of polygon data into volume data for rendering and editing. We include a series of 2D (post rendering) image space methods as enhancements to confocal microscopy visualizations, including 2D tone mapping, 2D compositing, and 2D color mapping.
FluoRender includes an algorithm-technique combination, which lets users interactively select desired structures from visualization results instead of 2D slices. By integrating the segmentation functions with a confocal visualization tool neurobiologists can easily extract complex neural structures within their typical visualization workflow.
Slides
|
|
|
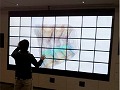
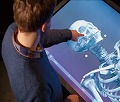
Science Portal – Volume Rendering in the Public Space
Anders Ynnerman
Linköping University, Sweden
Abstract:
The talk will also show how medical volume visualization can be used in knowledge dissemination in public spaces. By combining medical visualization techniques with interactive multi-touch table technology and intuitive user interfaces visitors to science centers and museums can interactively explore the normally invisible and learn about the inside workings of the human body, exotic animals, natural history subjects or even mummies, such as the recent installation at the British Museum. The talk will apart from showing interesting examples discuss requirements on the production pipeline from discovery to gallery – The Science Portal.
Slides
|
10:30 ? 11:00: Break
11:00 – 12:00: Session 6 (Chair: Chuck Hansen)

|
|
In Situ Visualization with Explorable Images
Kwan-Liu Ma
University of California ? Davis, USA
Abstract:
I will present the concept of explorable images as an in situ visualization solution. For extreme-scale simulations, explorable images enable scientists to validate as well as explore their simulation output at low cost using a desktop computer or even a mobile device. Explorable images for both scalar and vector field data are presented. Explorable image as a new media will potentially change how visualization of large-scale simulations is done.
Slides
|
|
|
Large-Scale Distribution-Based Data Analysis
Han-Wei Shen
The Ohio State University, USA
Abstract:
Scientists overview and identify regions of interest by transforming data into compact information descriptors that characterize simulation results and allow detailed analysis on demand. Among many existing feature descriptors, statistical information derived from data samples is a promising approach to taming the big data avalanche because data distributions computed from a population can compactly describe the presence and characteristics of salient data features with minimal data movement. The ability to computationally summarize and process data using distributions also provides an efficient and representative capture of information that can adjust to size and resource constraints, with the added benefit that uncertainty associated with results can be quantified and communicated. In this talk, I will discuss the effort in my research group in applying statistics based approaches for scientific data analysis and visualization. I will first motivate our approach by presenting some examples of how statistical information can help in data visualization, and then present our recent work on histogram representation and compression, multivariate analysis, and isosurface selection.
Slides
|
12:00 ? 13:30: Lunch
13:30 – 15:30: Session 7 (Chair: Eduard Gröller)
|
|
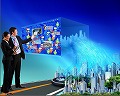
Urban Sensing and Visualization
Baoquan Chen
Shandong University, China
Abstract:
Digital Earth platforms such as Google Earth and Apple 3D Maps have seen explosive growth in applications by governments, industry, and end users. This has thus provided impetus for more efficient and capable tools to push representation and simulation of urban environments to a finer level than it is today. In this talk I will introduce our effort on acquiring and modeling large urban environments as well as analyzing and visualizing urban activities. I will also discuss future developments in this direction.
Slides
|

|
|
Urban Data Visualization
Claudio Silva
New York University, USA
Abstract:
For the first time in history, more than half of the world’s population lives in urban areas. Enabling cities to deliver services effectively, efficiently, and sustainably is among the most important undertakings in this century. While in the recent past, decision makers and social scientists faced significant constraints in obtaining the data needed to understand city dynamics and evaluate policies and practices, data are now abundant. Many cities have started to make a wide range of data sets available. The challenge now is how to make sense of these data.
In this talk, I will review some current and ongoing work on the visualization of Urban Data at NYU. The process of deriving effective visualizations of this data requires the use (and sometimes development) of techniques beyond visualization, including data management and machine learning. In turn, visualization is also useful for deriving new methods in these areas. The major outcome of this type of work is substantially improved data analysis capabilities.
Slides
|
 |
|
Video Visualization with Computer Vision
Masahiro Toyoura
University of Yamanashi, Japan
Abstract:
Computer vision skims through a video and perceives depth on behalf of humans.
Videos are being captured in anywhere by anyone. Skimming through them costs much effort and much time. Computer vision would do on behalf of us. In our ActVis (Activity Visualizer), a user defines a region of interest (ROI) in a screen. Activation level in the region is estimated from the amount of frame differential. Wearable sensors in smartphones support to identify a target in a video.
The loss of sight in one eye disables patients to do binocular disparity processing. Two cameras capture the stereo image required for reconstructing depth information on behalf of patients’ eyes. In our Mono-glass, estimated depth is visualized as blur in a single-channel video. Augmented reality (AR), real time video visualization in real world, would provide us a powerful tool.
Slides
|
|
|
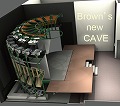
Brown’s Ultimate Immersive VR Display
David Laidlaw
Brown University, USA
Abstract:
At Brown we have been building a new virtual-reality display. To motivate this new device, I’ll describe some of the work we did using our 1998 Cave. It was a room of projected walls that surrounded a viewer with head-tracked stereo imagery. I’ll describe some of our experiences experimenting with that display and with user interaction in that unusual environment. I took away a feeling of magic from being in those virtual worlds, but, despite numerous attempts, it has been very hard to quantify why. Motivated by this mysterious magic (and some more pedestrian results), we are currently building a new virtual-reality cave that will vastly surpass the 1998 one. I’ll describe our design goals, the design we have been working from, and some of the lessons we’ve learned in building this new display. My hope is that it will move us forward into the next half century of research into the ultimate in displays for visualization and a theory that might explain the magic.
Slides
|
15:30 ? 16:00: Break
16:00 – 18:00: Session 8 (Chair: Klaus Mueller)

|
|
A Numerical Optimization-Based Method for Visualizing Graphs
Hiroshi Hosobe
Hosei University, Japan
Abstract:
Graphs provide abstract relationships between objects. Methods for visualizing or drawing graphs are usually developed for particular classes of graphs. Force-directed methods are often used for drawing undirected graphs. Although most of the existing force-directed methods can be viewed as using simulation algorithms, numerical optimization is also used for force-directed methods. This talk presents a numerical optimization-based force-directed method for drawing undirected graphs. Our method has sufficient generality to adopt different basic force models including those for the Kamada-Kawai and Fruchterman-Reingold methods. To achieve efficiency, we use the L-BFGS method for numerical optimization. Our experimental results show that the method gives good performance when combined with the Kamada-Kawai model.
Slides
|
|
|
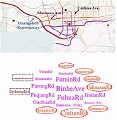
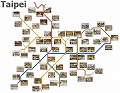
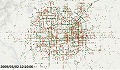
Designing Annotated Metro Maps through Constrained Optimization
Hsiang-Yun Wu
The University of Tokyo, Japan
Abstract:
In this talk, we present an approach to customizing the layout of a schematic metro map together with large annotation labels associated with important stations. The idea behind our approach is to formulate design criteria commonly employed by illustrators as mathematical constraints first and then optimizing the cost function in order to fully enhance the readability of the map layout. We consider two design rules for the metro map customization. The first design rule is travel-route-centered map layout where we elongate a specific travel route to be straight along the centerline of the map domain by introducing mixed-integer programming (MIP) technique, and annotate stations on the route with boundary labels aligned along the top and bottom borders of the entire map. The MIP formulation has been further extended to tackle the second design rule for spatially-efficient map layout, which allows us to place a large annotation label within a small neighborhood of the corresponding station through minimal deformation of the original map layout. Several design examples are also presented to demonstrate the feasibility of our prototype system together with user studies on how users are satisfied with the formulated design criteria.
Slides
|
|
|
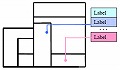
Static and Dynamic Boundary Labeling
Hsu-Chun Yen
National Taiwan University, Taiwan
Abstract:
In applications such as information visualization and cartography, map labeling is an important task which is concerned with efficiently placing extra information, in the form of text labels, next to features such as points, lines, or areas in a map. Among various labeling styles, boundary labeling associates each point site with a label placed on the boundary of an enclosing rectangle using a leader, which may be a rectilinear or straight line segment. Static boundary labeling is concerned with the design of algorithms to optimize certain quality measures (such as the total leader length, the number of crossings, etc.) when the underlying map is static. With the rising popularity of mobile devices, it is apparent that map labeling under a dynamic environment is of increasing interest and importance, in order to support navigation and focus-and-context visualization in dynamic maps. In this talk, we discuss various issues associated with boundary labeling from an algorithmic viewpoint in both static and dynamic settings.
Slides
|
18:00 ? 19:30: Dinner
12th March (Wed)
7:30 ? 9:00: Breakfast
9:00 – 10:30: Session 9 (Chair: Shigeo Takahashi)
|
|
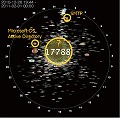
On the Visualization of Point Clouds
Ayellet Tal
Abstract:
If you try to draw a large point cloud, you may find that it is difficult to understand what the cloud represents. In this talk I will discuss the reduction of points, such that the visual comprehension of the set is improved. Two simple operators are utilized, the first computes the visible points from a given viewpoint and the second is its dual. Both operators work directly on the point cloud, skipping surface reconstruction.
Slides
|
|
|
Efficient Computation and Hierarchical Representationof Discrete Morse Complexes
Leila De Floriani
Abstract:
Discrete Morse theory provides a discrete analogue of Morse theory for cell complexes. It has been applied for the computation of Morse and Morse-Smale complexes in data analysis and visualization, and for efficiently computing homology and persistent homology of shapes discretized as cell complexes. However, memory constraints on the encoding of the discrete Morse gradient field have limited its practical usage to cubical complexes, or to simplicial complexes of limited size. We will first address the problem of the efficient encoding and computation of discrete Morse complexes in the simplicial case. We will present a simple compact encoding for the discrete Morse gradient field over a simplicial complex suitable to be combined with any data structure encoding just its vertices and its top simplices. We will demonstrate the effectiveness and scalability of our approach over large unstructured tetrahedral meshes by developing algorithms for computing the discrete Morse gradient field and for extracting the cells of the Morse and Morse-Smale complexes as well as their combinatorial description. In the second part of the talk, we will focus on the issue of reducing the complexity of the Morse and Morse-Smale complexes through simplification and a hierarchical representation. We will present a hierarchical combinatorial model for Morse complexes, the hierarchical Morse complex, generated through a sequence of simplifications applied to the original Morse (or MS) complexes, all encoded in a common combinatorial structure. The hierarchical Morse complex is the basis for extracting morphological representations of discretized shapes endowed with a scalar field at uniform or variable levels of resolution. This approach leads to a more general framework for encoding a family of finite cell complexes, generated through homology-preserving operators, from which homology generators can be extracted efficiently through an iterative refinement approach.
Slides
|
|
|
Large Scale Topological Analytics for Science Discovery
Valerio Pascucci
Abstract:
Advanced techniques for analyzing and understanding Big Data models are a crucial ingredient for the success of any data intensive scientific investigation. In this talk, I will present the application of a discrete topological framework for the representation and analysis of large scale scientific data. Due to the combinatorial nature of this framework, we can implement the core constructs of Morse theory without the approximations and instabilities of classical numerical techniques. The inherent robustness of the combinatorial algorithms allows us to address the high complexity of the feature extraction problem for high resolution scientific data.
Our approach has enabled the successful quantitative analysis for several massively parallel simulations including the study turbulent hydrodynamic instabilities, porous material under stress and failure, the energy transport of eddies in ocean data used for climate modelling, and lifted flames that lead to clean energy production.
I will close the presentation with a discussion of a number of open challenges in extending this class of data analytics for vector fields and scaling to massively parallel computing platforms.
Slides
|
10:30 ? 11:00: Break
11:00 – 12:00: Session 10 (Chair: Huamin Qu)

|
|
Gaze-directed Flow Visualization
Xiaoyang Mao
Abstract:
With the advance of high performance computing and modern numerical simulation
technology, flow fields obtained from the simulation are becoming more and more
large and complex. It is a challenging problem to display a large flow field in
the limited 2D space on a computer screen. In this talk, I will present a work
that try to adapt display resources to user intentions by using eye-tracking
data. When observing a flow field, users usually gaze at some particular
regions, such as around a critical point, the boundary of an object, and
selectively follow some important structure or interesting flow pattern. Since
“viewing” is the most important user task in flow observation, we assume it is
possible to predict users’ intentions, either conscious or unconscious ones, by
analyzing eye-tracking data. The proposed system uses eye-tracking data to
adaptively seed streamlines, pathlines and streaklines in 2D and 3D flow fields.
I will also propose a future research work that use eye-tracing data to learn a
user’s visual attention in visual exploration.
Slides
|

|
|
Visualization Driven by Perceptual Statistics
Ivan Viola
Abstract:
Vision science and data visualization are metaphorically speaking “communicating vessels”. The outcome of vision science frequently serves as a guideline for the visualization or interaction design. These guidelines are usually justified by knowledge about human cognition and perception that is already widely accepted. While century-old Gestalt principles are considered in the visualization design, more recent outcome from psychophysics studies is not coupled with the visualization design. Interestingly enough, there is no apparent symmetry in this interdisciplinary crosspolination: the visualization research outcome is not utilized in the vision science.
In my talk I will discuss two examples how psychophysics studies drive the visualization design. Instead of a well-sedimented knowledge about human visual system, the statistical description of human visual performance is used as an input for designing visualization. The first discussed example shows how surface perception task can gradually modify an algorithmical shading model so that the match between the distal and the proximal stimulus is maximized. The second example describes a construction of a perceptually uniform motion that can finds its application in animated representation of flows. While these outcomes are relevant for the scientific field of data visualization, the statistically described human performance can be inspiring material for follow-up in-depth vision science studies.
Slides
|
12:00 ? 13:30: Lunch
13:30 – 19:00: Excursion to Kamakura (Leaflet)
19:00 ? 21:30: Main banquet
13th March (Thu)
7:30 ? 9:00: Breakfast
9:30 – 10:30: Session 11 (Chair: Bauquan Chen)
|
|
Visual Analysis of Clickstream Data from Massive Open Online Courses (MOOCs)
Huamin Qu
Abstract:
Massive Open Online Courses (MOOCs) have become very popular recently. At Hong Kong University of Science and Technology, we offered several such courses which attracted a lot of students. The course material consists of a set of videos and the students’ clickstreams (e.g., play, pause, seek) on these videos have been collected. In my talk, I will present some preliminary results of analyzing the clickstream data and demonstrate how visualization techniques can help course instructors to better understand the student learning behaviors in the MOOCs.
Slides
|
|
|
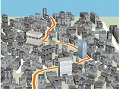
Animating Occlusion-Free Driving Routes in 3D Urban Areas with Spatiotemporal Constraint
Shigeo Takahashi
Abstract:
This talk presents an approach to navigating driving routes in 3D urban models while maximally avoiding their occlusions by surrounding buildings. The primary contribution of this paper lies in the formulation of spatiotemporal constraints for enhancing the readability of the animated 3D urban maps. Incremental optimization based on linear programming has been employed for this purpose by taking advantage of the history of computations at previous animation frames. This allows us to seek a reasonable compromise between the computation cost and visual quality of the navigation results. Examples will be provided to demonstrate that our computational approach can provide occlusion-free animations of driving routes in a visual plausible manner even in the complicated configurations of 3D urban models.
Slides
|
|
|
City Traffic Visualization
Xiaoru Yuan
Abstract:
As today we can obtain a very rich spectrum of data related to urban transportation every day, it would be great interesting to develop algorithms and system for visualizing such data sets. In this talk, I will discuss a few visual analysis works related to urban traffic data. In addition, I will also discuss how to exploit social media to understand more about the urban traffics.
Slides
|
10:30 ? 11:00: Break
11:00 – 11:30: Session 12 (Chair: Anders Ynnerman)

|
|
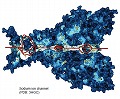
Visual Knowledge Discovery for Diffusion Kurtosis Datasets of the Human Brain
Amitabh Varshney
(Joint work with Sujal Bista, Jiachen Zhuo, and Rao P. Gullapalli)
Abstract:
Diffusion Kurtosis Imaging (DKI) provides the degree of diffusional non-Gaussianity of water molecules in biological tissues. This is gaining attention in the medical imaging community as it is able to provide a detailed view of the microstructure of the brain and can be used to help diagnose mild cases of traumatic brain injuries (mTBI). However, visualization of DKI datasets is challenging since it represents the brain microstructure through a large number of vectors (typically 32-64) at every voxel. I shall be presenting our results that explore visualization of DKI datasets through structural segmentation techniques to facilitate insights into microstructure changes in the brain.
Slides
|
11:30 – 12:00: Closing (Arie Kaufman/Issei Fujishiro)
12:00 ? 13:30: Lunch